0Abstract
Many Internet applications employ 3-tiersoftware architecture such as e-commerce system. Starting from analyze thearchitecture of an e-commerce development platform model based on 3-tiered Web,We present by using queuing network theory, we propose a reusable e-commercedevelopment platform based on 3-tiered Web. Finally, we implement the MVAalgorithm with the help of MATLAB and test the experimental data in LoadRunnerbenchmark.
1Introduction
The past few years have witnessed a tremendousgrowth in Internet Information and Web applications. E-Commerce is fleetlybecoming an everyday activity as consumers gain familiarity with shopping onthe Internet. The most common consideration is performance, because theseapplication systems eventually must provide cost-effective andhigh-availability services, therefore they have to be scaled to confront theexpected load.
Performance measurements can be the base forperformance modeling and prediction. The common performance metrics areresponse time, throughput, and resource utilization. Our primary goal was topredict the response time of JSP Web applications based on a queuing model,because response time is the unique performance metrics to which the users aredirectly confronted. Moreover, we also predict the throughput of the tiers ofWeb applications.
2Architecture and Design
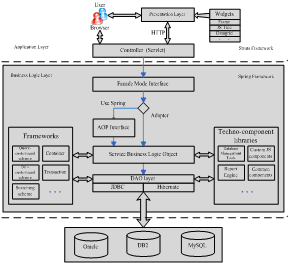
As one of thepopular distributed computing platforms, J2EE technology has become a core partof enterprise applications based on 3-tiered Web. The e-commerce developmentplatform architecture is shown in Figure 1.
2.1Presentation layer
The presentation layer compose of JSP pages,pages components (DataGrid, menu, ComboBox, Textbox, date .etc.) and Taglib(Struts tags and component tags), which used to be operated by users anddisplay the results. Powerful and rich components will lead to an excellentresult of the page displaying and the user’s operation. When realizing thepresentation layer, we use the Struts framework implementing function ofController and Dispatcher.
2.2Business logic layer
The main task of the business logic layer is torealize the complex business. From the database perspective, these operationsusually involve a number of database tables and complex nested transaction; Fromthe object-oriented perspective, these business objects relies on a number ofrelated business objects or data access object and involves the map among severaltables. When realizing the business logic, we use the AOP technology of Spring abstractingbusiness logic in higher level. Thus modify the business rules according to thedemand of the users in specially situation.2.3Database Access Layer
Data persistent can be realized by the dataaccess object, the main job of the data access object is adding, modifying andquerying the basic data, .etc. but, it is not including the complex business.The key of the data access layer is to construct the reusable object layer withtechnologies of independent data access layer. The technologies in the dataaccess layer are various and the Hibernate and SQL Helper is main platform atpresent.
3Model Design and Analysis
3.1Model Description
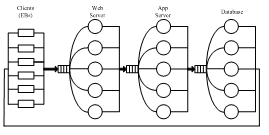
The most commonly deployedinfrastructure of Web services is the 3-tiered architecture which is shown inFigure 2. In this 3-tiered architecture, on the front-end of a representativeWeb site is the Web server that acts as the presentation layer. The mainfunction of this tier provides Internet information browse services. All thebusiness logic for a Web site resides in the 2nd tier (application server).This server receives request from 1st tier, processes the information in the3rd tier (database server). Database server is the warehouse of a Web site’sinformation. Everything from user accounts and types notifies and customerorders are stored in database.
Figure 2 Queuing Network Model of 3-Tiered Web Services Architecture
3.2Estimation of the Model Parameters
In this section, For analyzing performance of 3-tieredWeb model, the following parameters are required as inputs: the number ofapplication tiers T, respectively on a per-classbasis the number of coinstantaneous browser connections (N1,N2,…,Nn),the average user think time Zn, for Qt the average service time St and the visit ratio Vt.During the measurements the number ofapplication tiers was constant (T=3). There were two classes session operation.The number of the first one was fixed at 10, the second one was varied. For the sake of determining Zn we averaged the sleep times in the user scenario each class. In order to determine St we averaged the service times of each page and class remaining with the given tierand class. The visit ratios can be estimated as Vt ≈ λt / λreq , where λt is thenumber of requests of each page and class resided in the given application tierand class, and λreq is thenumber of requests belong to the given class of the whole application.
Computing Average Response Time Equation:
Computing Throughput Equation:
3.3Model Evaluation and Validation
Our experimental setup and experimental validation of the model in J2EE environment is demonstrated.
The Web server of our test Web application was IBM server with Eclipse 3.2 environment, one of the most popular among middle enterprise platforms. The database management system was My SQL 5.0; development environment is composed of Eclipse 3.2,Hibernate3.0 and Spring 2.0; The server runs on a 3.0GHz Inter Pentium 4 processor, it had 2GB of system memory; the operating system was Windows Server 2003 with Service Pack 1. The client running on a 1.8 GHz Inter(R) Core(TM) 2 Duo T5470 processor with 1GB of system memory; the operating system was Windows XP Professional with Service Pack 2. The connection among the computers was provided by a 100 Mb/s network.MATLAB (MatrixLaboratory) is a numerical computing environment and programming language. It will be used to implement MVA (Mean-Value Analysis) algorithm and evaluatesystem performance measurements with model parameters as input. There were two classes of sessions: a database reader and a database writer. The number of coinstantaneous browser connections of one class was fixed at 10, while thenumber of coinstantaneous browser connections of the other class was varied from 40 to 100. The user think time of per request was varied from 0.01s to0.10s.
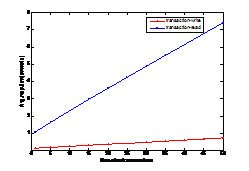
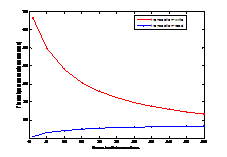
Figure 3 the Predicted Average Response Time Figure 4 the Predicted Throughput
Figure 3 indicate the delay trend of average response time, with the number of coinstantaneous browser connections varying from 1 to 50. Increasing the numberof simultaneous browser connections, the read transaction average response time grows linearly, while the uptrend of write transaction is inconspicuous. In the overloaded status, the read transaction average response time becomes magical high. Figure 4 demonstrate the effect of throughput, with the number of coinstantaneous browser connections varying from 1 to 50. Increasing the numberof simultaneous browser connections, before the saturation the write transaction throughput (transactions/second) slip sharply, while read transaction throughput grow slack. After the saturation the read transaction throughput remains close to constant.
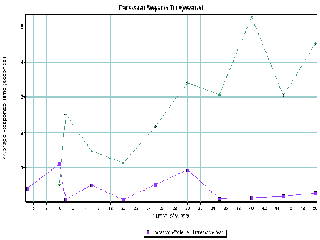
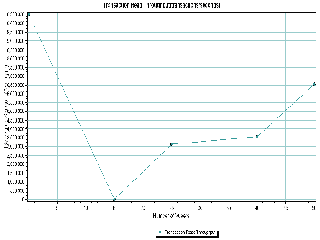
Figure 5 the Validated Average Response Time Figure 6 theValidated Transaction Throughput
We validated that the average response time and throughput of JSP Web applications (Figure 5 and Figure 6). The validatedresult indicated that the MVA algorithm evaluate the average response and the throughput acceptably well.
